Dyno Spectrum DS2 Datalogging Software Basics Part 1
The Dyno Spectrum DS2 datalogging is a powerful datalogging software based upon the popular MegaLogViewer HD datalogging software by EFI Analytics. However, powerful software can have a powerful learning curve. Let's break things down and start with the basics.
 |
| First Load Screen |
Doesn't look like much at first glance, but that's because a log file needs loaded before the software can really do anything. DS2 supports any log file of the CSV file type. Sometimes if you have Microsoft Excel installed, it will try to associate with CSV files, so be aware.
 |
| Data log file loaded |
Ok, so we have loaded a data log and there's more stuff on the screen, but none of that data is anywhere to be seen besides a few numbers in the lower window. "Where's the fancy graphs", I hear you asking. Hold up, we'll get there. First, let's pick some variables. In the "Quick view" area on the left, under Graph 1, clicking on any of the empty slots will open up a drop down to select a variable. Start out by setting the first three slots to the following:
- Eng spd (Engine Speed)
- Load rel (Load Relative)
- Pedal
 |
| Choosing a variable |
 |
| Wow....Graphs |
Now our software is starting to look like something. Let's break down the various areas.
 |
| This is the three major ways to view logs |
This is the three major ways to view and breakdown the data stored in a log. For the sake of this tutorial, we're going to stick to the first tab, "Log Viewer" as the other two tabs, "Scatter Plots" and "Histogram / Table Generator" will be covered by more advanced tutorials.
Playback Controls shows the current point in the log, and has the following playback controls in order from left to right:
 |
| Quick Views |
Quick Views are a way to organize how your graphs are displayed and organized. I use separate Quick Views to break down graphs by fuel, ignition, boost, etc. Organizing makes it easier to analyze data later as you get more familiar with the software.
 |
| The Dashboard |
The Dashboard shows all the current readings stored in the log (this can be filtered).
 |
| Playback Controls |
Playback Controls shows the current point in the log, and has the following playback controls in order from left to right:
- Stop
- Pause
- Play
- Zoom out (changes the zoom by showing more data across the horizontal axis of all graphs)
- Zoom in (does the opposite of above)
- Go to first record (Back to the beginning of the log)
- Page back
- One record back
- One record forward
- Page forward
- Jump to last record (End of the log)
 |
| Graph Data |
Each graph will show some important data in the top left, top right, and bottom left corners.
- Top Left - The maximum value of selected variable for the entire log
- Bottom Left - The minimum value of the selected variable for the entire log
- Top Right - The current value or the selected record (indicated visually by the vertical blue line)
Note maximum and minimum values can sometimes be messed up by the beginning or end of the log because the engine wasn't running when the log started or shut off before logging was stopped. This can be fixed by trimming the log which we will cover later.
One of the most powerful menus is opened by right clicking on any graph. This context menu contains the following options:
 |
| Graph Right Click Context Menu |
- Marks - Allows a mark (bookmark / flag) to mark up this record of the log for reference later
- Log Editing - Allows to delete all log data before or after the cursor position
- Set Current Time to Zero
- Expression Search (advanced topic will not be covered here)
Underneath the Expression Search option, there will be a menu item for each variable displayed in that graph.
 |
| Variable "Jump to", "Search for", and Value offsets menu |
- Jump to Max - Jumps to the record in log where that variable maximum value was recorded
- Jump to Min - Jumps to the record in log where that variable minimum value was recorded
- Search for specific "variable name" - Search the log for a specific value
- Search for "variable name" Greater than - Search the log for the next record with a value larger than specified (a dialog box pops up asking for an input value)
- Search for "variable name" Less than - Search the log for the next record with a value less than specified (a dialog box pops up asking for an input value)
- Value offsets (advanced topic will not be covered here)
Let's continue this tutorial by creating our own Quick View. Click the little page with plus icon and a dialog box will appear asking for a name. Type in "Boost".

All variables in the previous Quick View are automatically copied into the newly created Quick View. Let's create a second graph by selecting the following variables under the first three open slots of "Graph 2".
 |
| Boost Quick View |
- Pres intake manifold abs (Pressure measured in intake manifold absolute)
- Pres pre throt B1 (Pressure before throttle body Bank 1)
- Pres pre throt B2 (Pressure before throttle body Bank 1)
- Pres tgt before throt (Pressure target before throttle body)
Now we have two graphs displayed. However the data in the boost graph can be visually misleading because of how the graphs are being scaled. This can sometimes lead to a lower number displayed as higher than another value. We don't want this so for the purpose of the tutorial, let's set manual scaling. The little "hamburger" icon to the right of each variable has options for scaling and field smoothing.
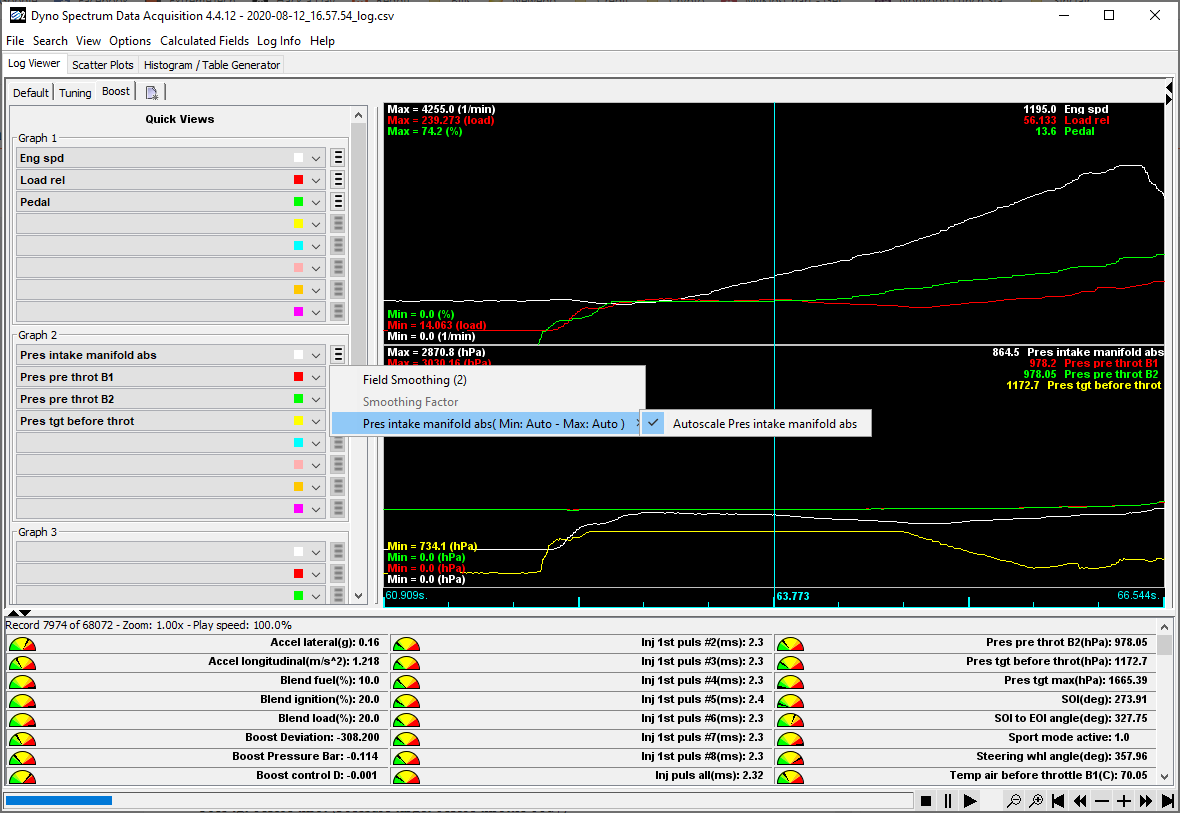 |
| Field Scaling |
Uncheck the option for Autoscale. A dialog box will pop up allowing you to set scaling manually. Set the minimum value to 0 and the maximum value to 3000. Do this for the other three variables in Graph 2.

 |
| Manually Scaled Graph |
Notice a couple differences from before manual scaling was set. For one, the Max Graph display now shows our manual scaling with the auto scale values in brackets. This is an easy way to tell that manual scaling is being applied to a variable. Second, the "Pres tgt before throt" variable displayed in yellow is now visually higher than the other variables.
I think that covers enough for today. When exiting the software, a prompt will ask whether this newly created Quick View tab should be saved. For part 2, I will cover trimming a specific section from a log and comparing two logs side by side.


Comments
Post a Comment